plot_fd
Plot the functional data.
Description
This function aims to plot the funcational data. The form of functional data is defined by this package.
Usage
plot_fd(x, y = None, xlab = None, ylab = None, title = None, colors = None,
        linestyles = None, legend = None, grid = False, figsize = (8, 6))
Parameters
This part shows the meanings and data types of parameters. Users can check the table below to plot a figure of functional data.
Parameter |
Description |
|---|---|
x |
dict, functional data object(s) to be plotted. |
y |
str, sequence of points at which to evaluate the functions x and plot on the horizontal axis. |
xlab |
str, a label for the horizontal axis. |
ylab |
str, a label for the vertical axis. |
title |
str, a label for the vertical axis. |
colors |
str, determines the colors of elements in the plot. If a color (e.g., “blue”) or a list of colors is provided, the plot will use those colors instead of the defaults. |
linestyles |
str, sets the line styles in the plot. Options include solid (“-“), dashed (”–“), dash-dot (“-.”), and dotted (“:”). |
legend |
str, a boolean indicating whether to show the plot’s legend. Set to False if the plot has many sequences to avoid clutter. |
grid |
bool, a boolean for displaying grid lines. Set to True to show them, aiding in data value estimation. |
figsize |
tuple, a tuple defining the figure’s width and height in inches. Adjust these values to change the figure’s size. |
Value
The function plot_fd plots the figure of functional data. Here are two example graphs for this function:
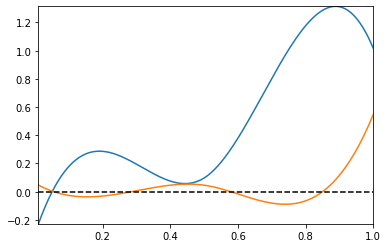

Examples
Here is a quick example for using this function:
from GENetLib.fda_func import dense_to_func
# dense_to_func: a function to convert densely measured data into functional data
from GENetLib.sim_data import sim_data_func
from GENetLib.plot_gene import plot_fd
func_continuous = sim_data_func(2, 30, 'Continuous')
location = list(func_continuous['location'])
X = func_continuous['X']
dense_to_func_res = dense_to_func(location, X, btype = "Bspline", nbasis = 5, params = 4, Plot = False)
plot_fd(dense_to_func_res)
Previous: predict_func | Next: plot_rawdata