func_ge
G-E interaction analysis via deep learning when the input X is functional data.
Description
This function provides an approach based on neural network in conjunction with MCP and L 2 penalizations which treats functional data or discrete realizations of functional data.
See also at sim_data_func and grid_func_ge. The model is FuncGE.
Usage
func_ge(y, X, location, Z, ytype, btype, num_hidden_layers, nodes_hidden_layer, num_epochs, learning_rate1, learning_rate2, nbasis1, params1, lambda1 = None, lambda2 = None, Lambda = None, Bsplines = 20, norder1 = 4, split_type = 0, ratio = [7, 3], plot_res = True, plot_beta = True)
Parameters
This part shows the meanings and data types of parameters. Users can check the table below to build a customizable FuncGE model.
Parameter |
Description |
|---|---|
y |
numeric, an array representing the response variables. |
X |
numeric or dict, a matrix representing the sequence data with the number of rows equal to the number of samples or a “fd” item which represents the functional data. |
location |
list, a list defining the sampling sites of the sequence data. |
Z |
numeric, a matrix representing the scalar covariates, with the number of rows equal to the number of samples. |
ytype |
character, “Survival”, “Binary” or “Continuous” type of the output y. |
btype |
character, “Bspline”, “Exponential”, “Fourier”, “Monomial” or “power” type of spline. |
num_hidden_layers |
numeric, number of hidden layers in the neural network. |
nodes_hidden_layer |
list, contains number of nodes in each hidden layer. |
num_epochs |
numeric, number of epochs for neural network training. |
learning_rate1 |
numeric, learning rate of sparse layers. |
learning_rate2 |
numeric, learning rate of hidden layers. |
nbasis1 |
integer, an integer specifying the number of basis functions that constitutes the genetic variation function. |
params1 |
integer, in addition to rangeval1 (a vector of length 2 giving the lower and upper limits of the range of permissible values for the genetic variation function) and nbasis1, all bases have one or two parameters unique to that basis type or shared with one other. |
lambda1 |
numeric, tuning parameter of the first MCP penalization. |
lambda2 |
numeric, tuning parameter of the second MCP penalization. |
Lambda |
numeric, tuning parameter of L2 penalization. |
Bsplines |
integer, an integer specifying the number of basis functions that constitutes the genetic effect function. |
norder1 |
integer, an integer specifying the order of bsplines that constitutes the genetic effect function, which is one higher than their degree. The default of 4 gives cubic splines. |
split_type |
integer, types of data split. If split_type = 0, the data is divided into a training set and a validation set. If split_type = 1, the data is divided into a training set, a validation set and a test set. |
ratio |
list, the ratio of data split. |
plot_res |
bool, “True” or “False”, whether or not to show the line plot of residuals with the number of neural network epochs. |
plot_beta |
bool, “True” or “False”, whether or not to show the graph of predicted functions. |
Value
The function func_ge outputs a tuple including training results of the FuncGE model:
Residual of the training set.
Residual of the validation set.
C index (y is survival) or R2 (y is continuous or binary) of the training set.
C index (y is survival) or R2 (y is continuous or binary) of the validation set.
A neural network after training.
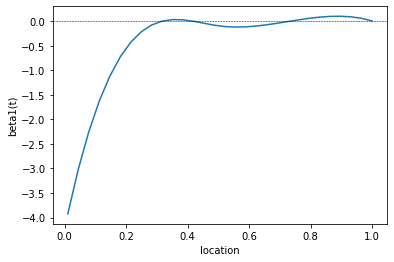
Estimated coefficients of the chosen basis functions for the genetic effect function beta0(t) and interaction items betak(t).
The estimated genetic effect function beta(t) and interaction items betak(t).
Here is an example output for an established model:

In terms of visualization, this function can output the plots of reconstructed functions. Here is an example output:


Examples
Here is a quick example for using this function:
from GENetLib.sim_data import sim_data_func
from GENetLib.func_ge import func_ge
num_hidden_layers = 2
nodes_hidden_layer = [100,10]
learning_rate2 = 0.035
Lambda = 0.01
learning_rate1 = 0.02
lambda2 = 0.01
num_epochs = 50
nbasis1 = 5
params1 = 4
func_continuous = sim_data_func(n = 1500, m = 30, ytype = 'Continuous', seed = 123)
y = func_continuous['y']
Z = func_continuous['Z']
location = func_continuous['location']
X = func_continuous['X']
func_ge_res = func_ge(y, X, location, Z, 'Continuous', 'Bspline', num_hidden_layers, nodes_hidden_layer, num_epochs, learning_rate1, learning_rate2, nbasis1, params1, lambda1 = 1.1*lambda2, lambda2 = lambda2, Lambda = Lambda, Bsplines = 5, norder1 = 4, split_type = 1, ratio = [3, 1, 1], plot_res = True, plot_beta = True)
Previous: scalar_ge | Next: grid_scalar_ge